 New: App Performance Dashboard is live!
Ever wondered how your app is performing? Didn’t manage to get observability added to your MVP? Now you can find out with the new Performance Dashboard coming to the Developer Portal!
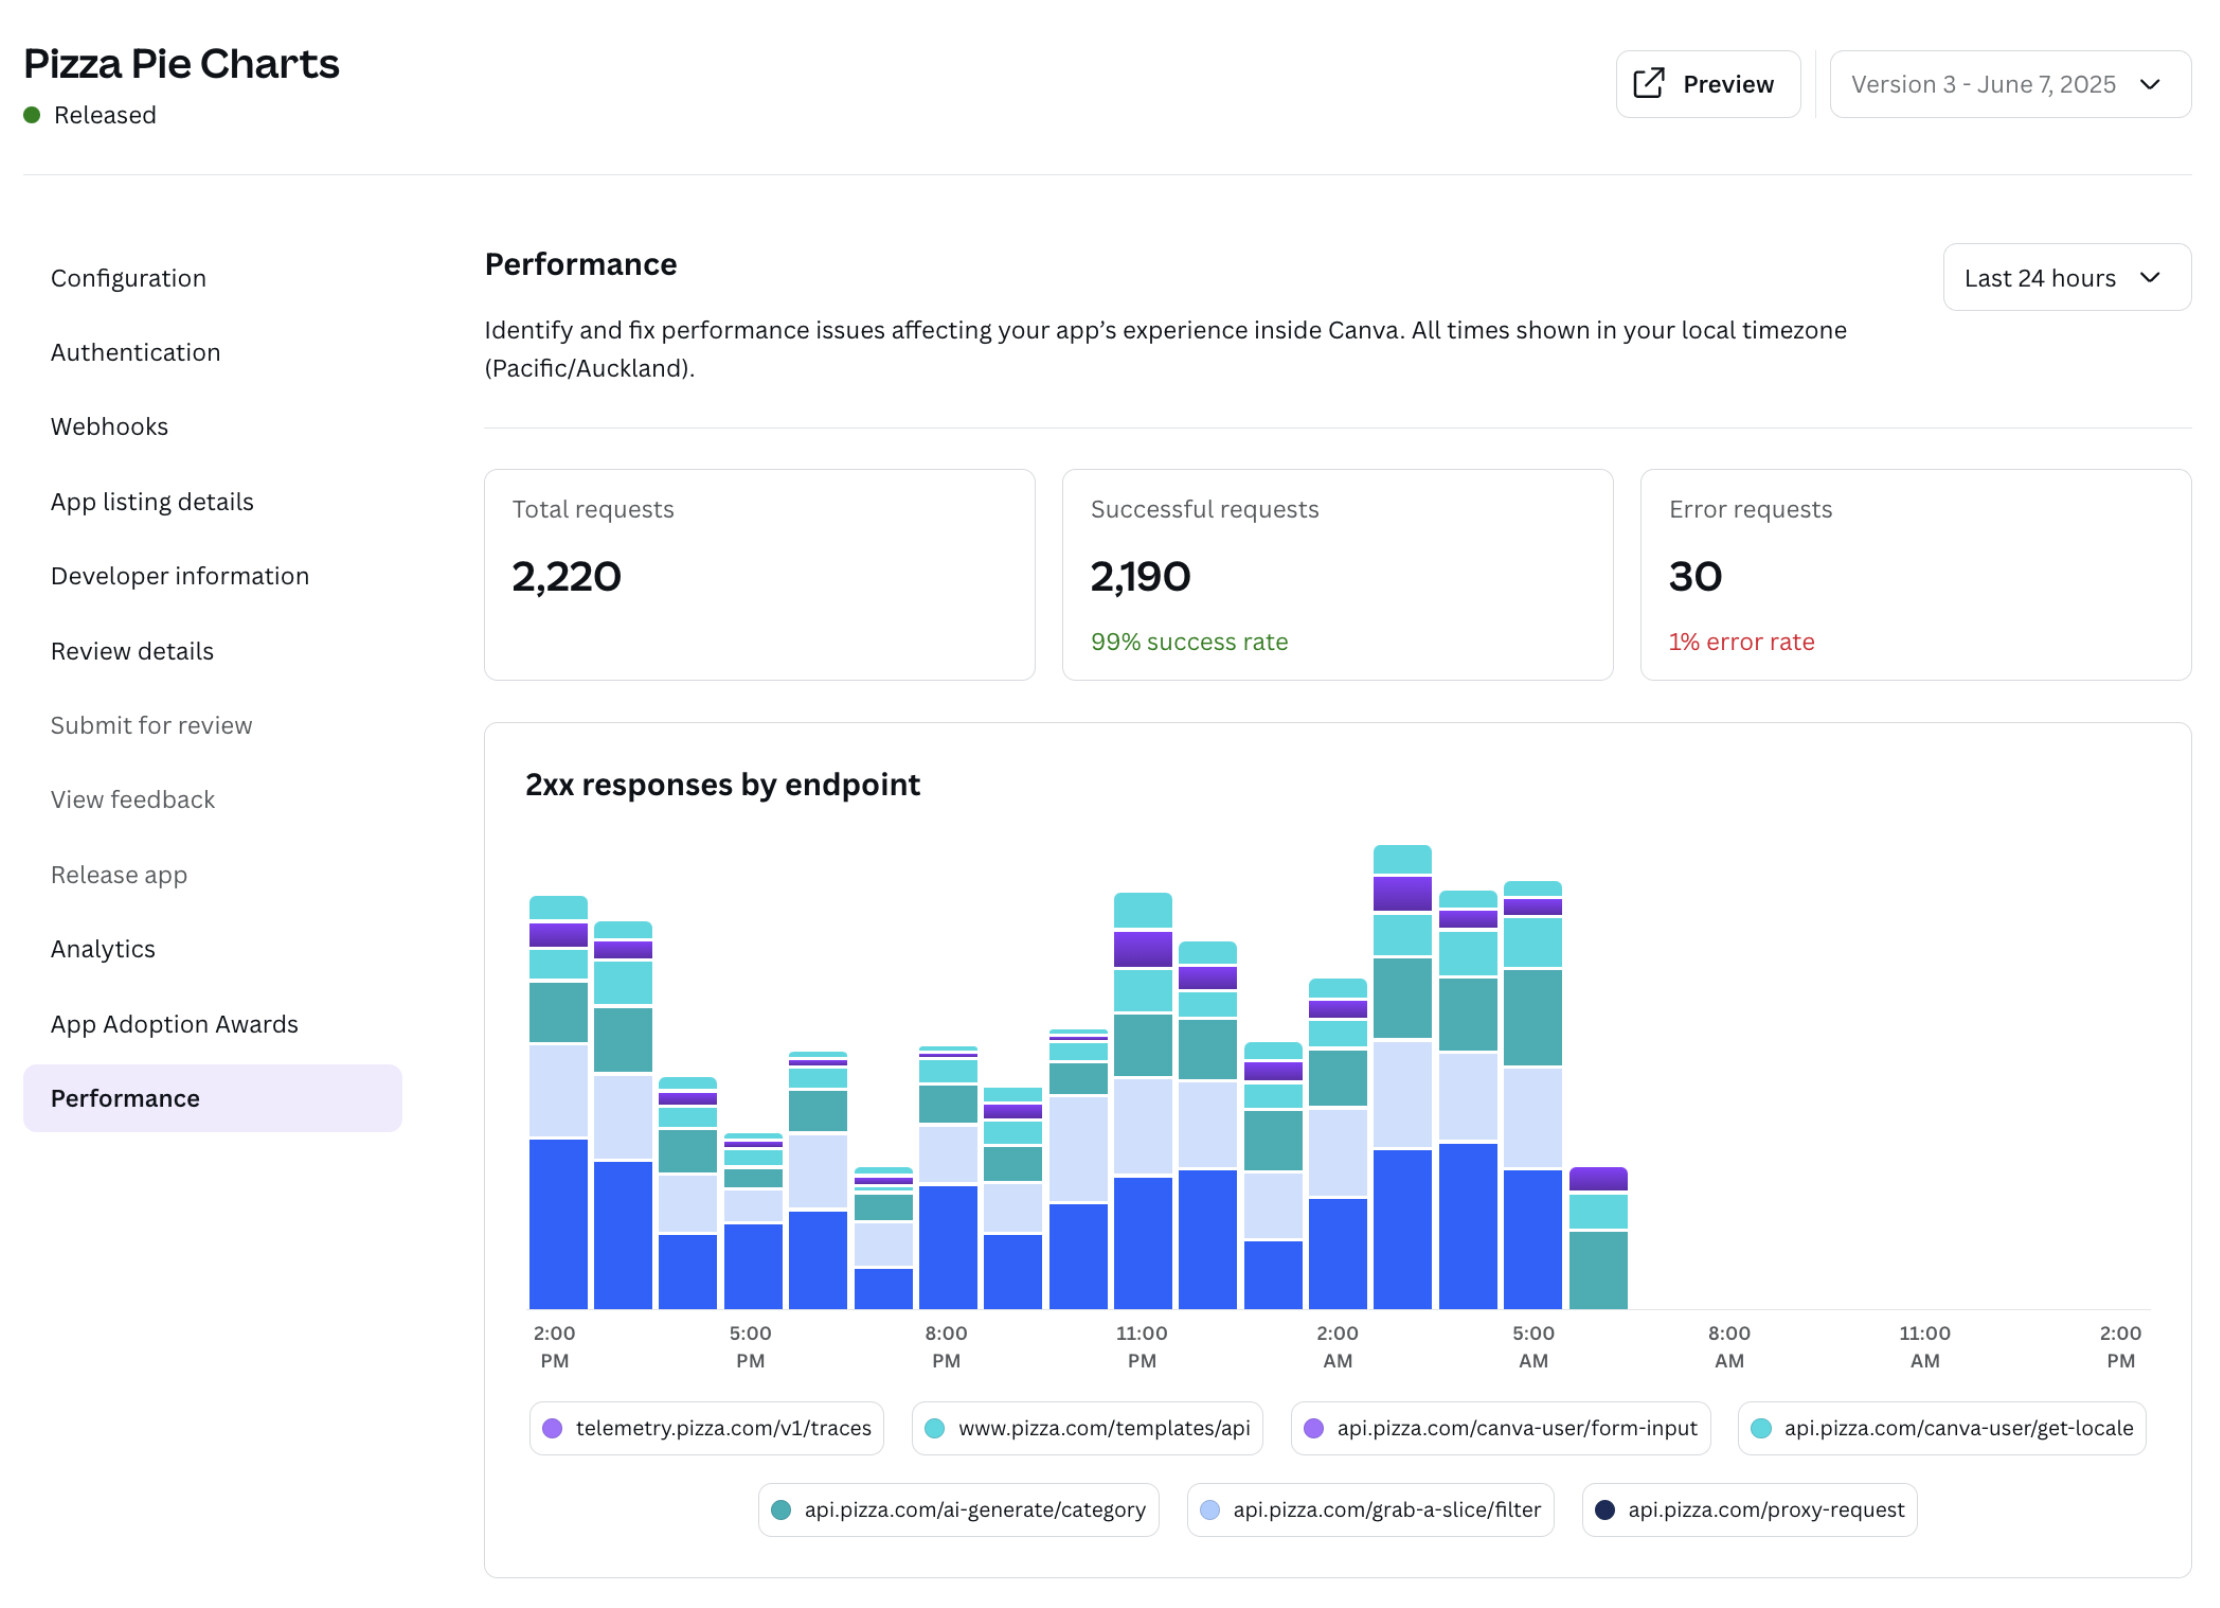
Here’s what you’ll see:
 Error rates broken down by response code and endpoint
 Latency tracking to monitor how responsive your app is
 Adjustable timeframes so you can see trends over a 30 day period or zoom in by the minute to pinpoint when issues started and were resolved.
This dashboard gives you visibility into how your app is behaving with real-world use, allowing you to squash bugs faster, optimize responsiveness, and deliver a smoother experience to your users.
 We’ll be rolling this out from today over the next 2 weeks so head to the new Performance tab in the Dev Portal and take a look—are there any issues you can clean up to make your app even better?
Got feedback or ideas on what other metrics you’d love to see? Drop them below! 
 (Had to ask, doubt that’s on the roadmap)